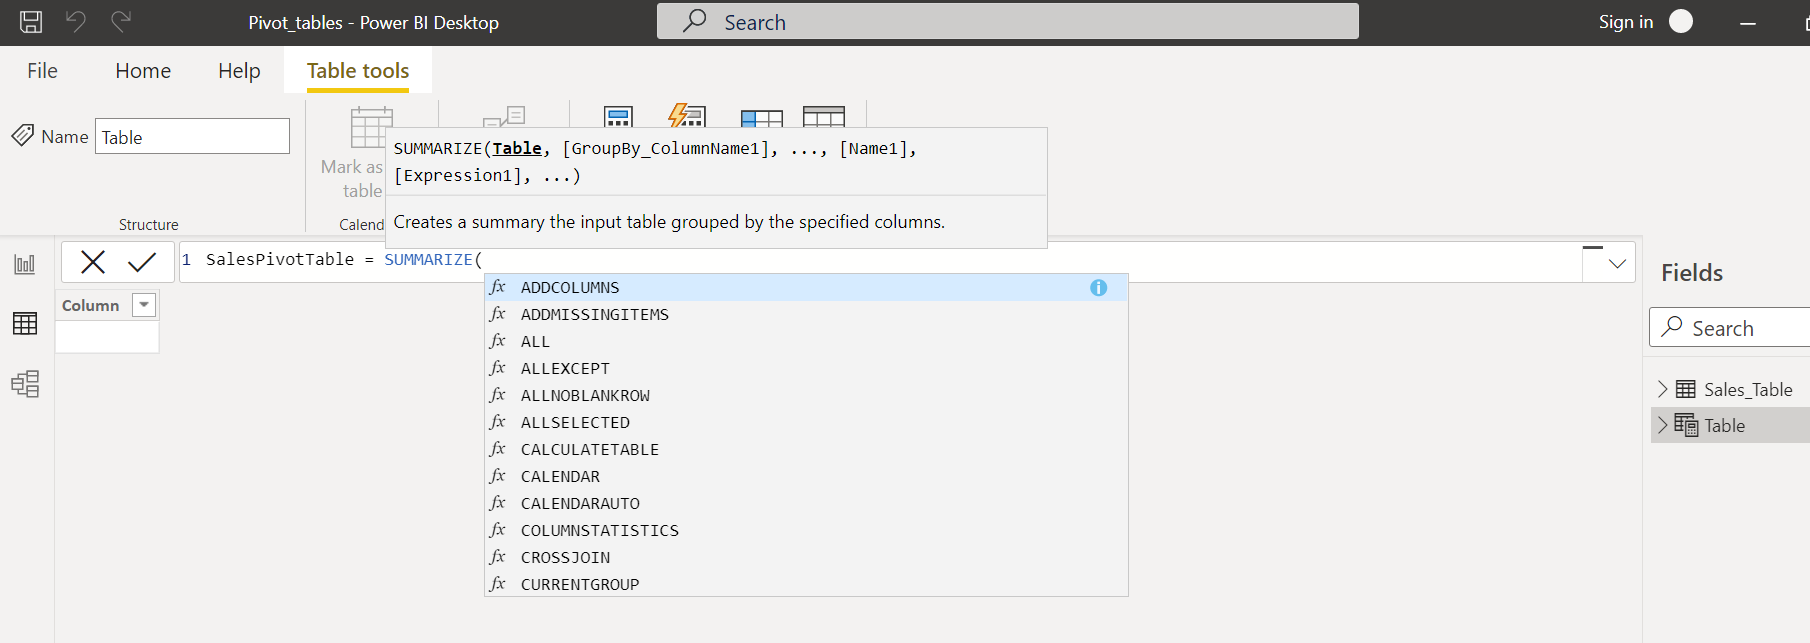
You can us DAX function SUMMARIZE
General syntax of the function is:
SUMMARIZE (table, groupBy_columnName[, groupBy_columnName]…[, name, expression]…)
Note: This approach returns whole table.
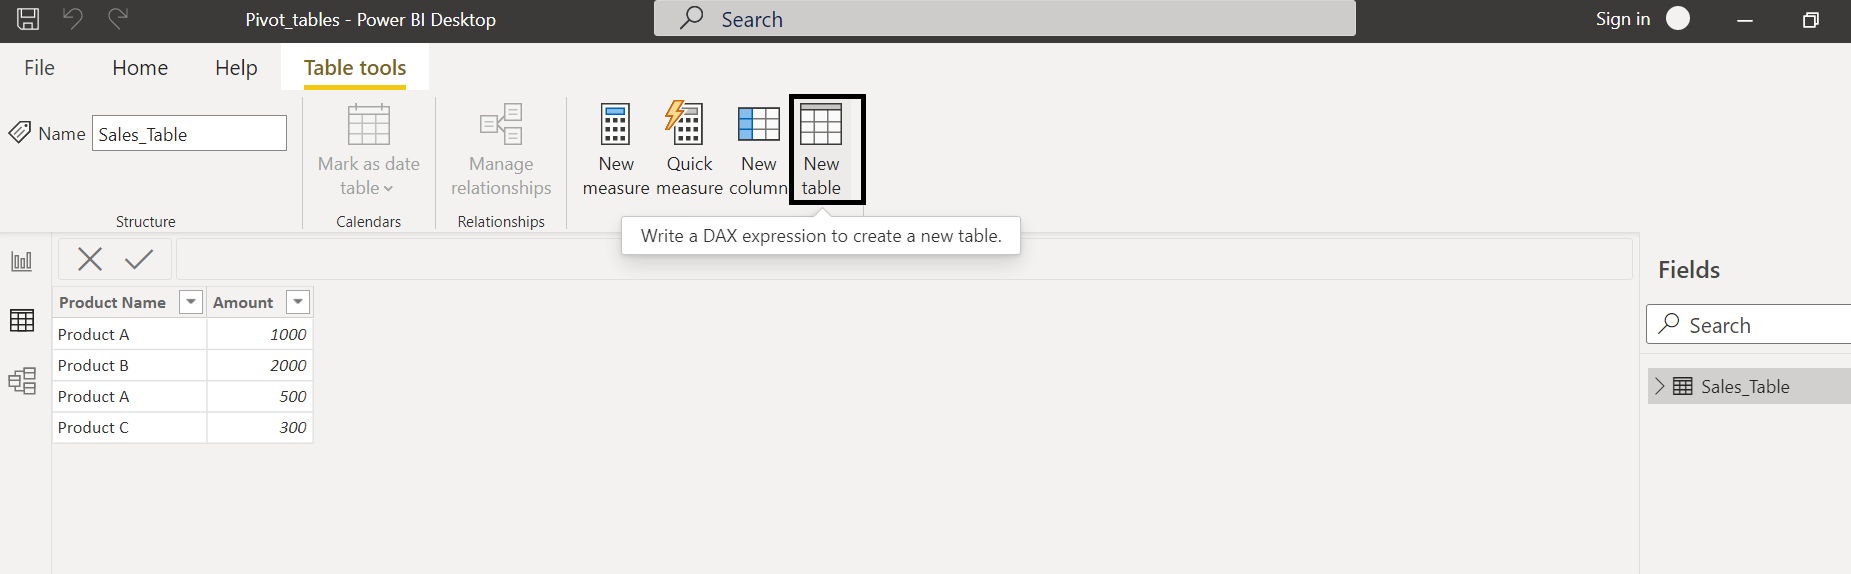
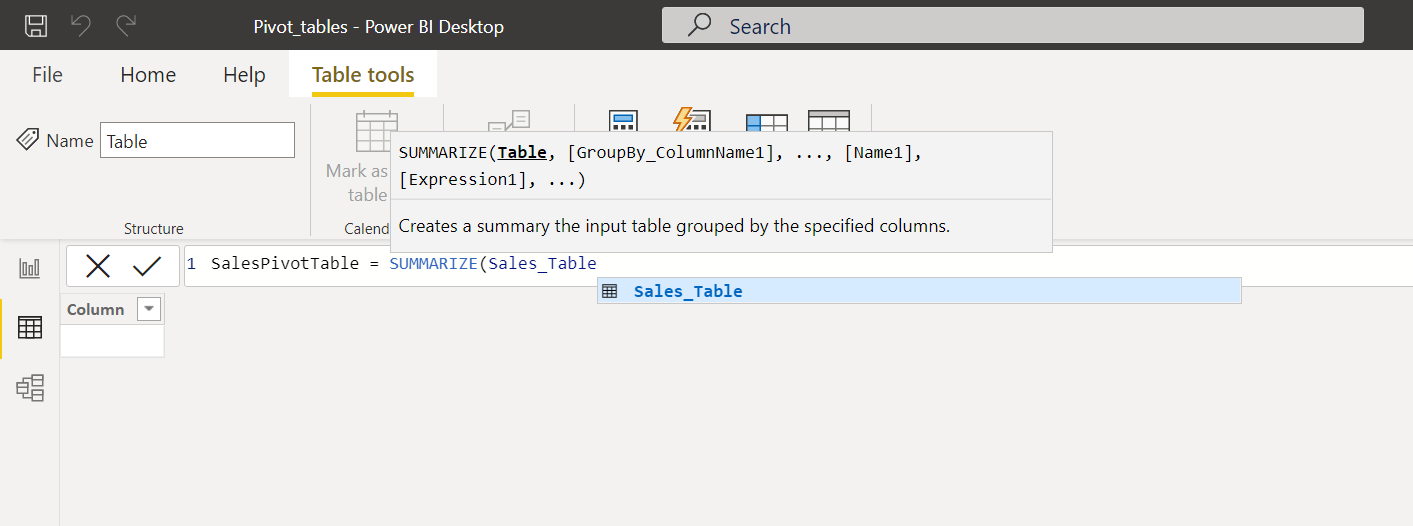
Step 1 Click on New Table button
Start to type formula name SUMMARIZE:
Step 2 Choose table you need to aggregate (in our example Sales_Table):
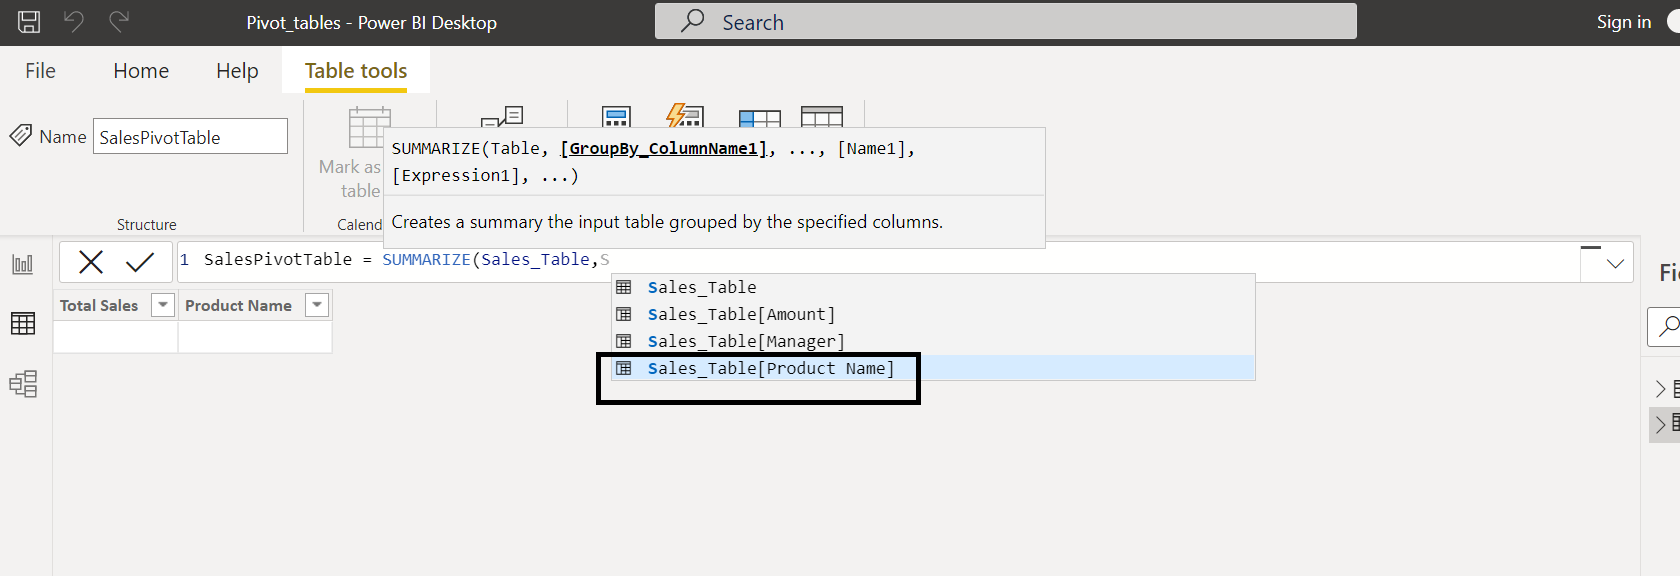
According formula syntax, you need select dimensions. If we need to create a pivot table by product we should use column that contains names of products:
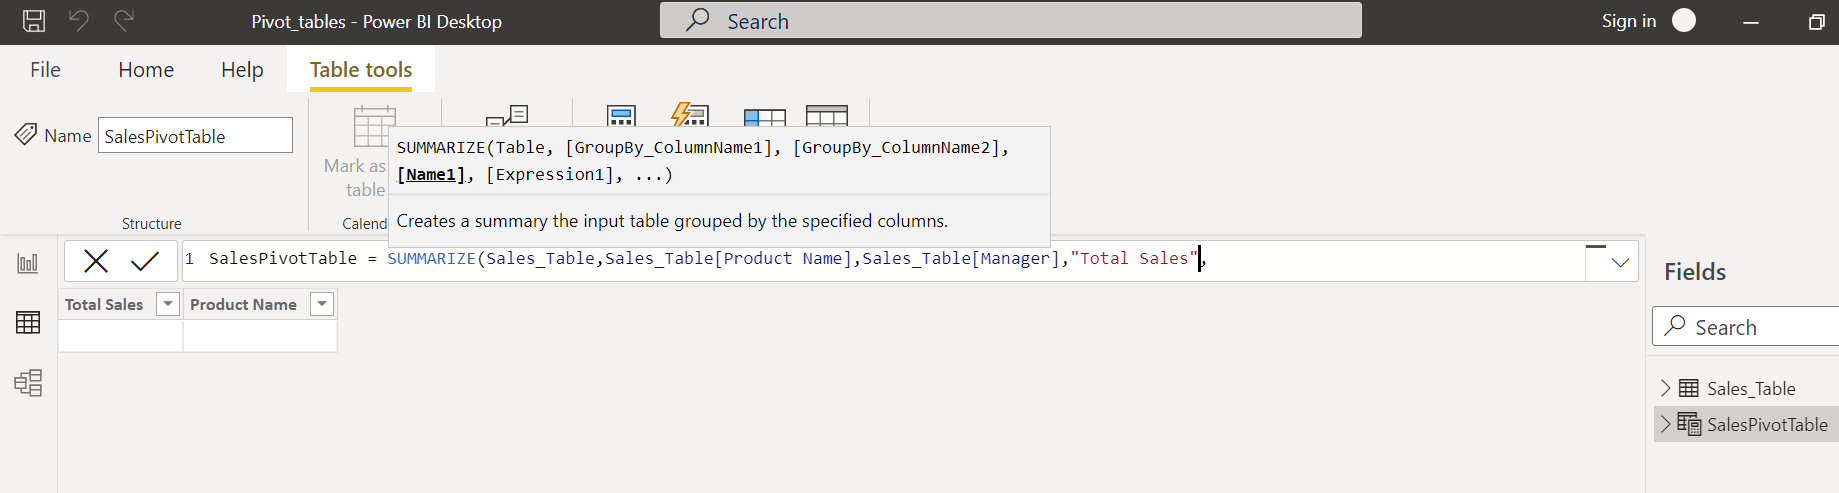
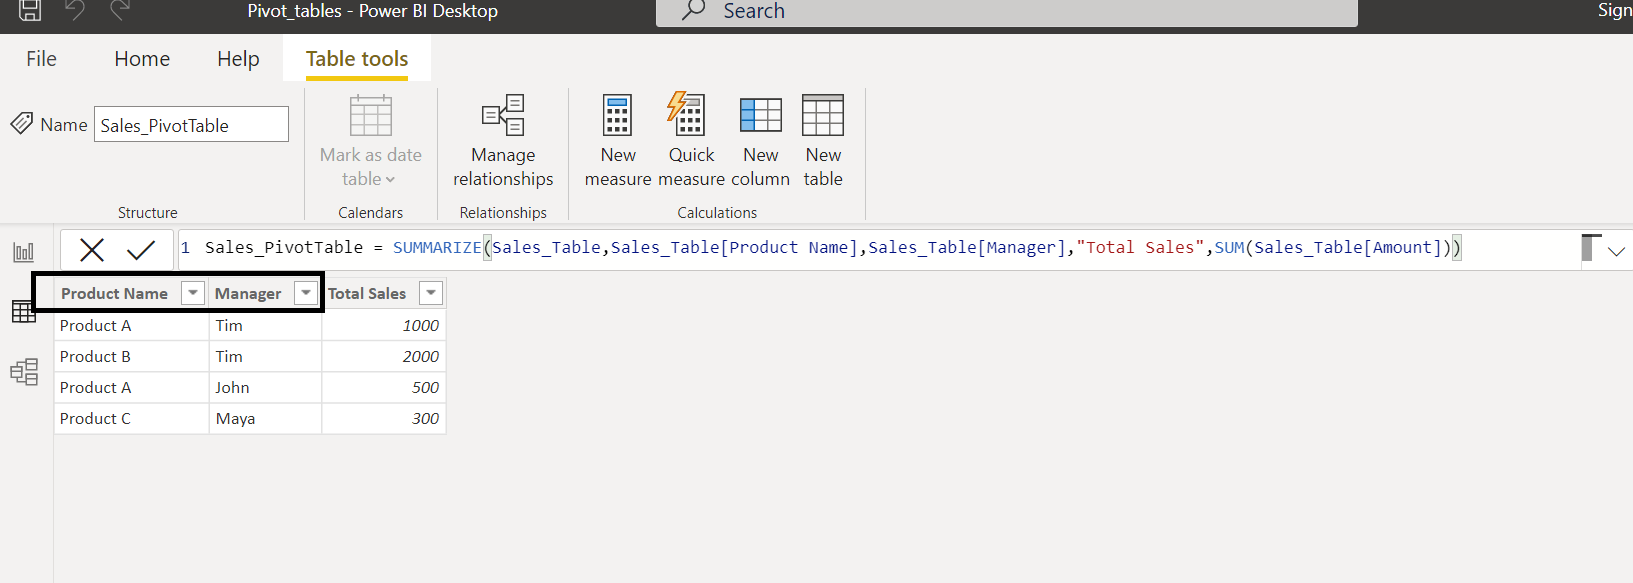
Additional category column adds additional dimension.
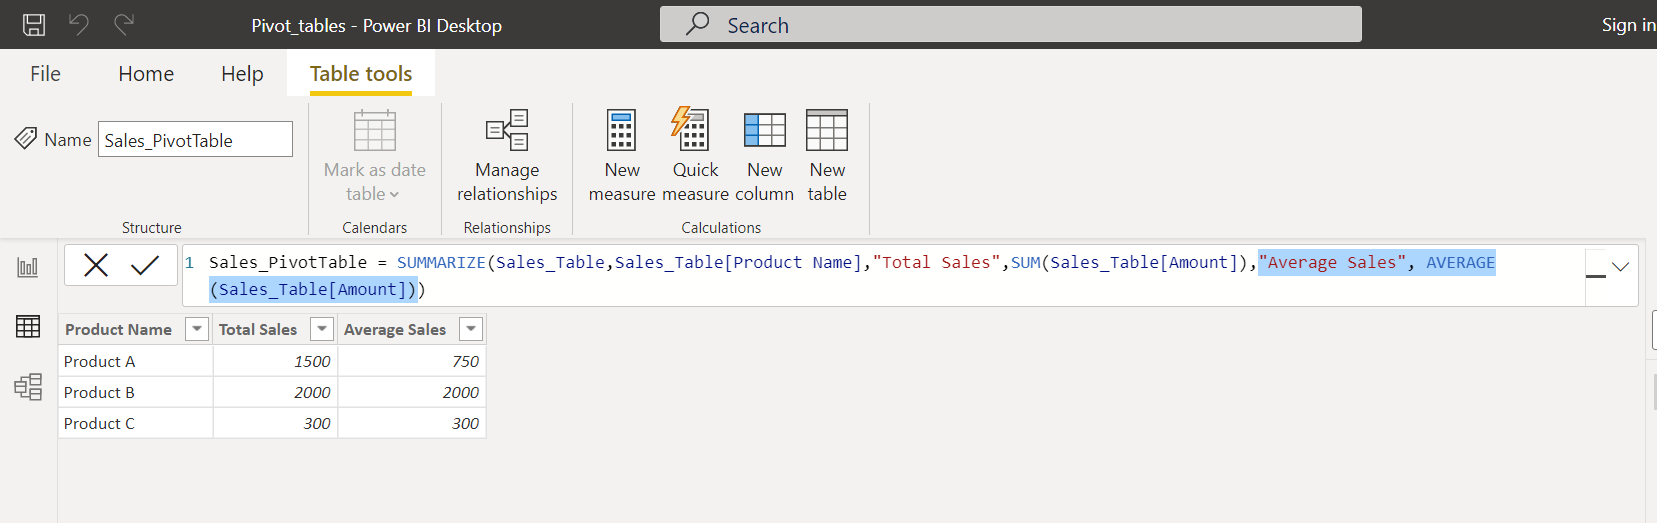
Step 3 After determine dimension structure we have to write name of the aggregate column, for example "Total Sales":
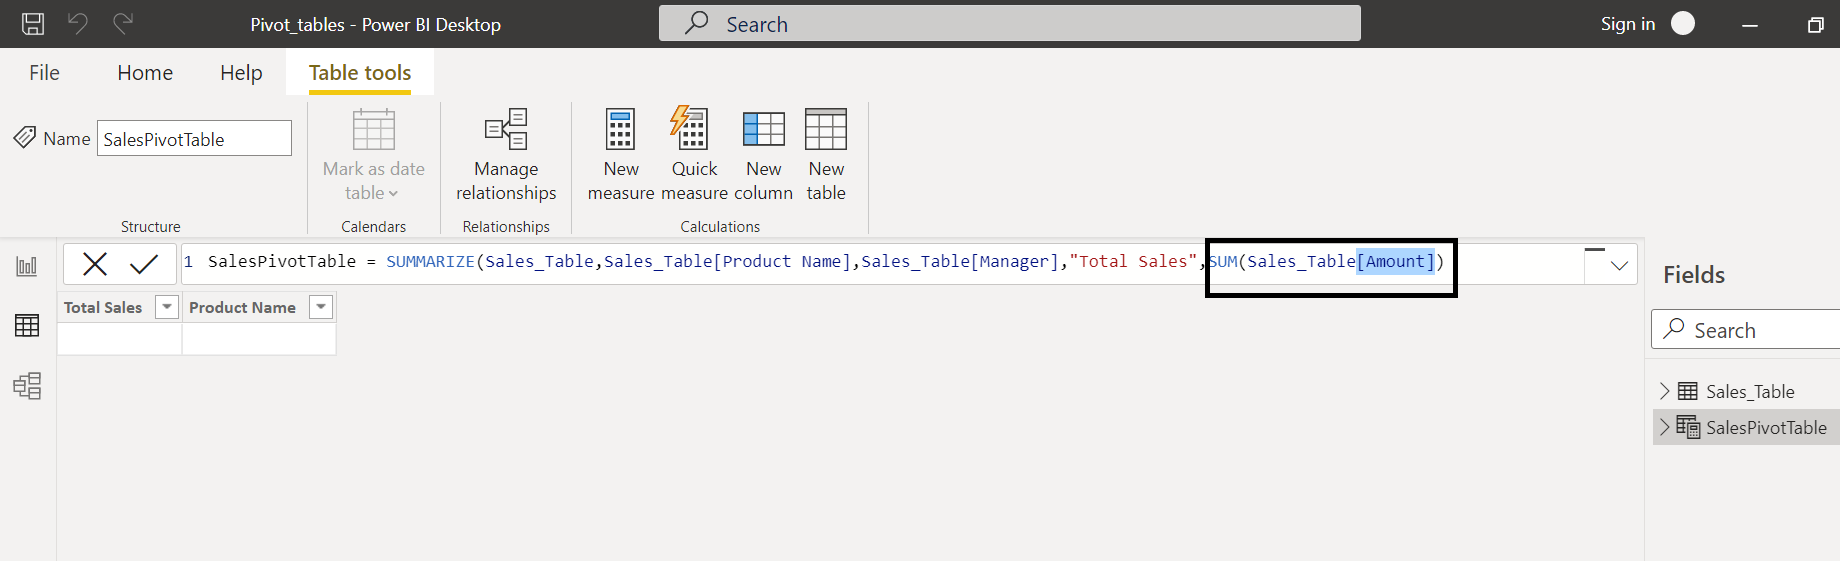
Step 4 We choose formula of data aggregation: SUM - for sum value of the data series; AVERAGE – for average value of the data series; etc. This formula we apply to column ([Amount]) which contains data about sales amount.
Result table has two demension - Product and Manager:
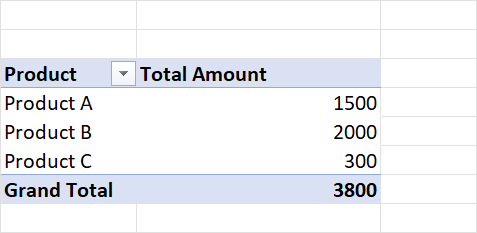
If we delete one dememsion we obtain our needed reult table as presented in Excel:
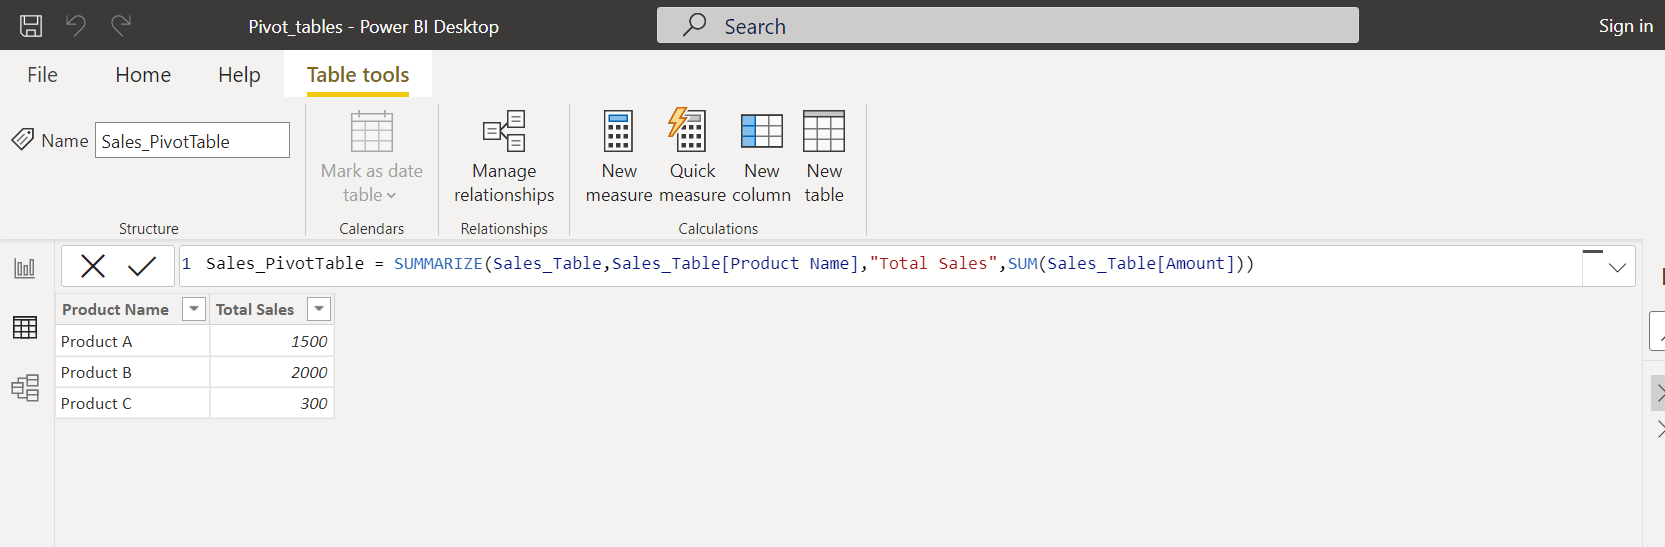
Final formula we have: Sales_PivotTable = SUMMARIZE(Sales_Table,Sales_Table[Product Name],"Total Sales",SUM(Sales_Table[Amount]))
If you need addition columns in pivot table, you add it by such rull: [Column Name],[Expression]: